Market Data Dashboard — Real Estate AI Prompt
TL;DR: A clean data-dashboard infographic with charts and rankings — repurpose as a "developer/district performance" market dashboard. Use this ChatGPT Image 2.0 prompt to quarterly market-data dashboard post. Replace the bracketed inputs with your details, paste into ChatGPT, and download the result.
Good for
- Quarterly market-data dashboard post
- "Top 10 [district] performers" leaderboard graphic
- Investment-update report cover
What you need
- Topic of dashboard (developer rankings, district trends, project comparison)
- 5-10 data points
- Time period
The realtor-adapted prompt
Copy the prompt below, paste it into ChatGPT (with image generation enabled), and replace each [your X] placeholder with your real details.
生成一张数据可视化风格的房产市场仪表盘,A3 横版。深色背景 #0a0a12,霓虹紫色高亮 #8b5cf6。顶部大字标题「[your title, 例如 2026 Q1 新盘表现榜]」+ 副标题「[your subtitle, 例如 Top 10 by PSF Growth]」。布局分3列:左栏是大柱状图(10个发展商或项目的对比);中栏是2-3个圆环图(市场份额、价格区间分布、销售速度);右栏是排行榜列表「[1. The Orie — +12.3%]」「[2. ...]」直到第10位。底部数据来源「Source: URA · Compiled by [your name] · [your phone] · [date]」。风格:彭博终端美学,数据科技感。
How to use this prompt — step by step
- Open ChatGPT (chat.openai.com) and start a new chat.
- Make sure image generation is enabled (use ChatGPT Plus, Pro or Team).
- Paste the realtor-adapted prompt above into the chat input.
- Replace every
[your X]placeholder with your real details. Don't leave any placeholder unfilled. - Press send and wait 10–30 seconds. Download the generated image.
- (Optional) Generate 2–3 variations and pick the strongest before publishing.
Original prompt
View the original (unmodified) source prompt
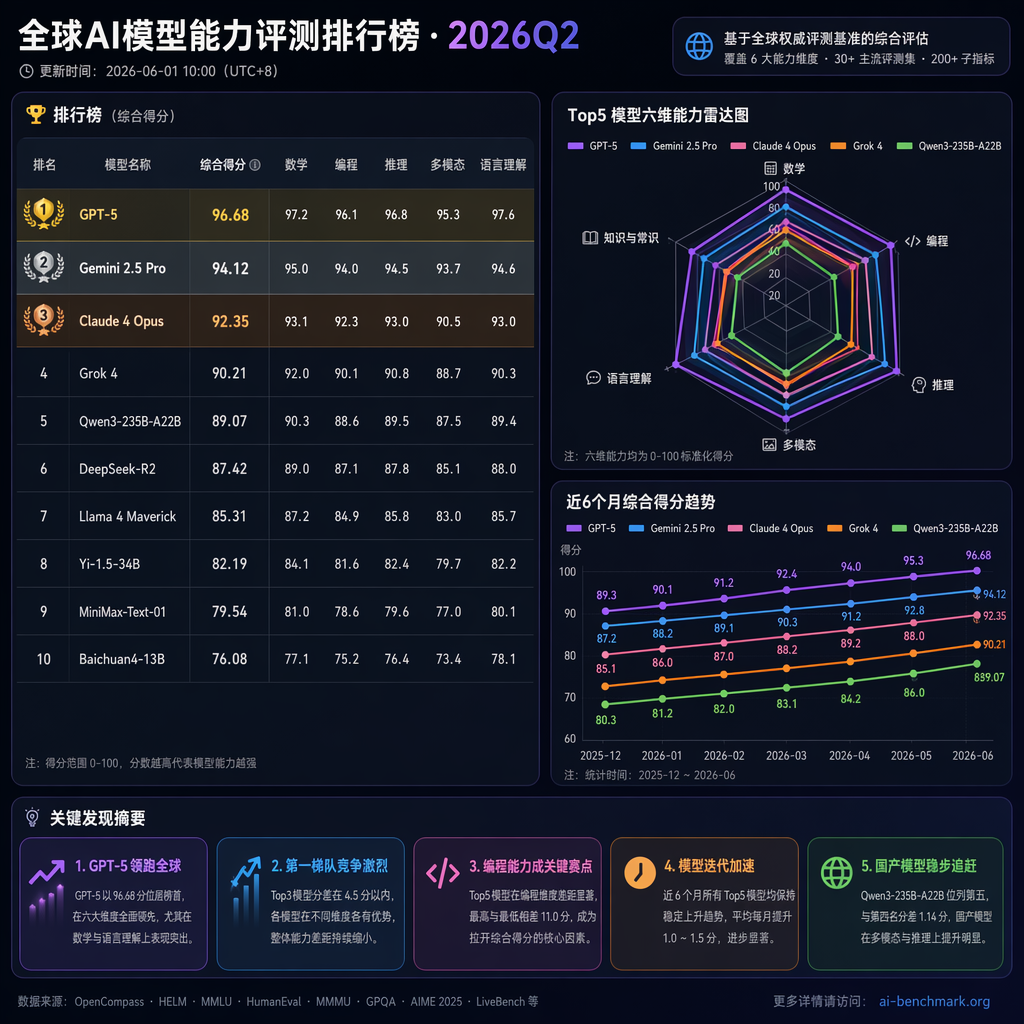
一张专业的数据可视化仪表盘截图。主题是「全球AI模型能力评测排行榜·2026Q2」。深色背景(#1a1a2e),包含:①顶部标题和更新时间②左侧大排行榜表格(模型名、综合得分、数学、编程、推理、多模态五个维度分数,前3名金银铜高亮)③右侧上方雷达图(对比top5模型的六维能力)④右侧下方折线图(近6个月各模型分数变化趋势)⑤底部关键发现摘要区。配色用蓝紫渐变主调,数据清晰可读。中文标注。
Frequently asked questions
Is the Market Data Dashboard prompt free to use?
Yes. The library is free forever. The realtor adaptations are written by the PostAI Editorial Team and licensed for free commercial use. The original prompt is sourced under CC BY 4.0 (where applicable).
What inputs do I need for the Market Data Dashboard prompt?
Check the 'What You Need' section above. Typically you need a relevant photo (your own or the property's), a project / brand name, a one-line headline or tagline, and your contact details.
Can I customise the Market Data Dashboard prompt for my market?
Yes. Replace the bracketed placeholders with details specific to your market — district, price range, project name, language. The prompt structure works equally well for Singapore, Malaysia, Hong Kong, the United States, the United Kingdom and Australia.
How do I avoid making the graphic too dense?
Pick one number to be the hero (e.g., one big YoY %) and let supporting data live in smaller annotations. The prompts encode this hierarchy.
Should I show negative trends?
Yes. Buyers trust agents who report cooling markets honestly. Position negative trends as opportunities ("Q3 cooled 1.3% — good window for upgraders").